
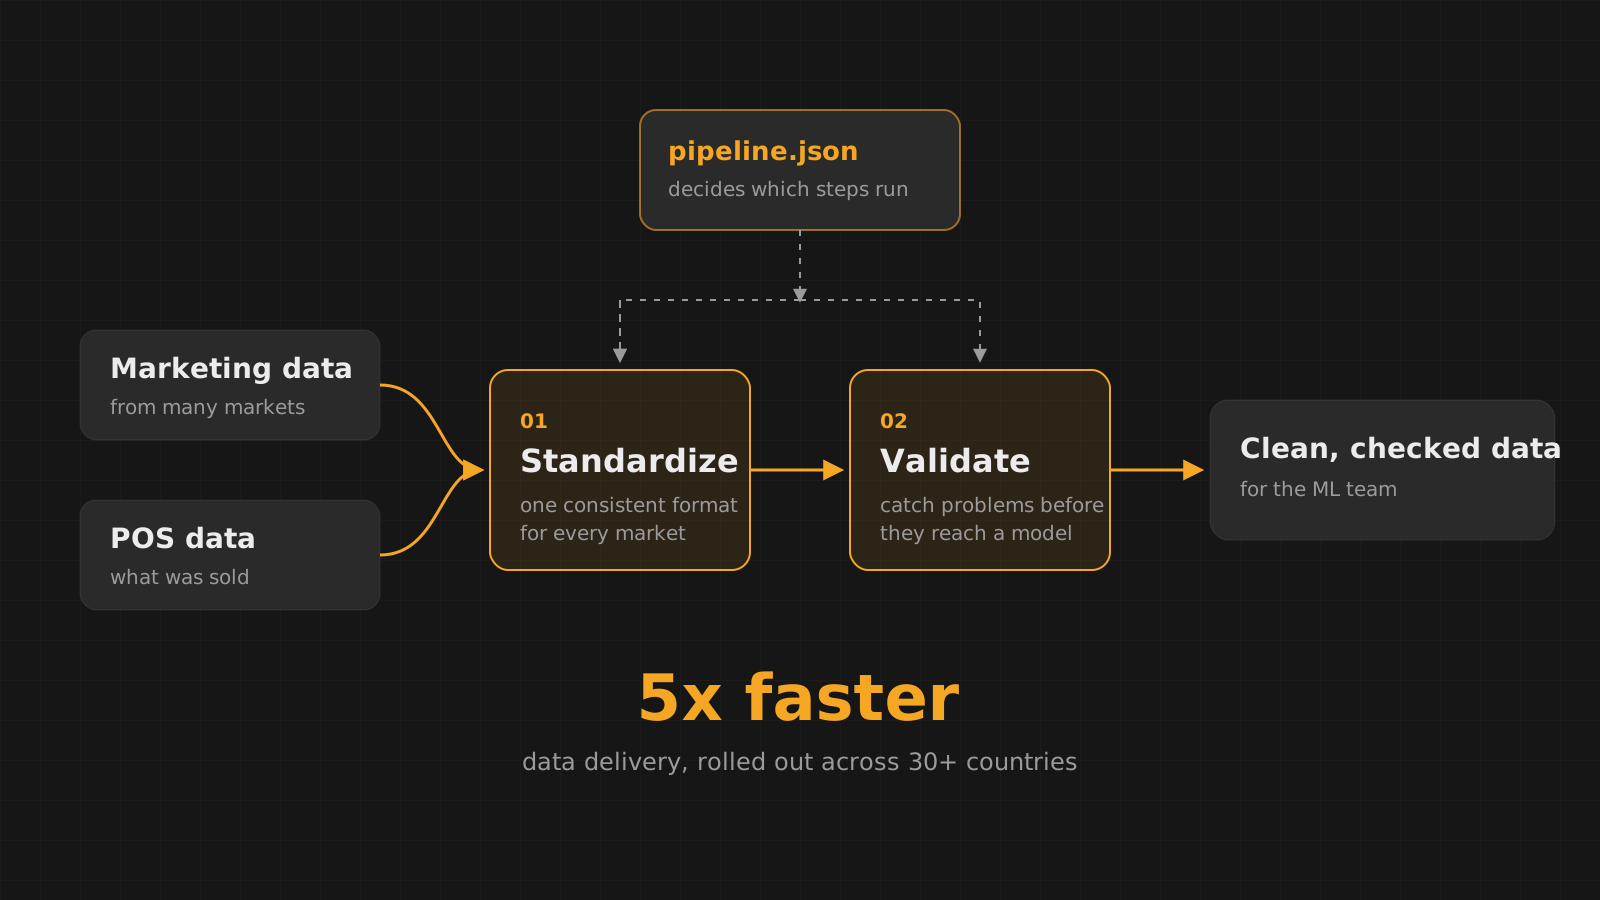
In 2021, at Wow Internet Labz, I worked on data for AB InBev, one of the world’s largest brewers. Their machine learning team needed marketing data and point of sale (POS) data from markets around the world, and getting it to them was slow. I built the pipeline that fixed that, from scratch.
This is how it came together.
2021
The brief
Machine learning models are only as good as the data they learn from. The team building them needed two kinds of data: marketing data, and POS data about what was actually sold. Both arrived from many countries, each with its own habits, formats and gaps.
Before the data could be used, someone had to clean it, and that was the bottleneck. Every new delivery meant slow, careful manual work before the ML team could touch it.
The starting point
Cleaning code in notebooks
The cleaning lived in Jupyter notebooks. They worked, in the sense that the right person running the right cells in the right order got clean data out. But notebooks like that are hard to rerun, hard to review and easy to break: steps get run twice or skipped, logic gets copied between notebooks and drifts apart, and nobody can tell at a glance what was actually done to a file.
The cleaning logic was there. It just had no structure.
So the first job was giving it one: pulling the useful logic out of the notebooks and turning it into clear, reusable functions, each doing one job.
The build
Standardize, then validate
I built two pipelines from scratch. The first standardizes: it takes data that arrives in different shapes from different markets and brings it into one consistent format. The second validates: it checks the standardized data and catches problems before they reach a model, where they would be much harder to spot.
- LoadRead the raw marketing or POS files for a market.Python
- StandardizeBring every market's data into the same structure and format.pandas, NumPy
- ValidateCheck the standardized data and flag anything that doesn't pass.pandas, NumPy
- DeliverHand clean, checked data to the machine learning team.Python
The design
One JSON file to run it all
The heart of it is how the pipeline decides what to do. Every cleaning and checking step is a Python function, and a single JSON file lists which functions run, for which data, and in what order. The pipeline reads that file and runs exactly what it says.
{
  "pos": {
    "standardize": ["rename_columns", "parse_dates", "convert_units"],
    "validate": ["check_required_columns", "check_value_ranges"]
  },
  "marketing": {
    "standardize": ["rename_columns", "parse_dates"],
    "validate": ["check_required_columns", "check_duplicates"]
  }
}That made it easy to grow. A developer adding a new cleaning step writes the function, adds its name to the JSON file, and it becomes part of the pipeline. It didn’t matter how many functions existed in the code: if a function’s name wasn’t in the config, it never ran. Nothing could slip into the pipeline by accident, and changing what the pipeline does never meant editing the pipeline itself.
The interface
A button for every stage
To make it easy to use, I built an app in Streamlit that runs the pipeline one stage at a time, each at the click of a button. Instead of opening a notebook and running cells in order, you pick the data, press a button for a stage, and see the result before moving on to the next one, with Matplotlib charts to visualize the data along the way.
The result
From slow rollouts to 30+ countries
With the pipeline in place, data reached the machine learning team 5 times faster than before, and it was rolled out across more than 30 countries. The cleaning logic that once lived in scattered notebooks became one structured, reviewable pipeline that anyone on the team could run, and any developer could extend.